
A decision workspace for stock investors.

Research stocks with proven investing frameworks, make sense of the results with plain-English AI explanations, and keep the thinking behind each decision in one place.

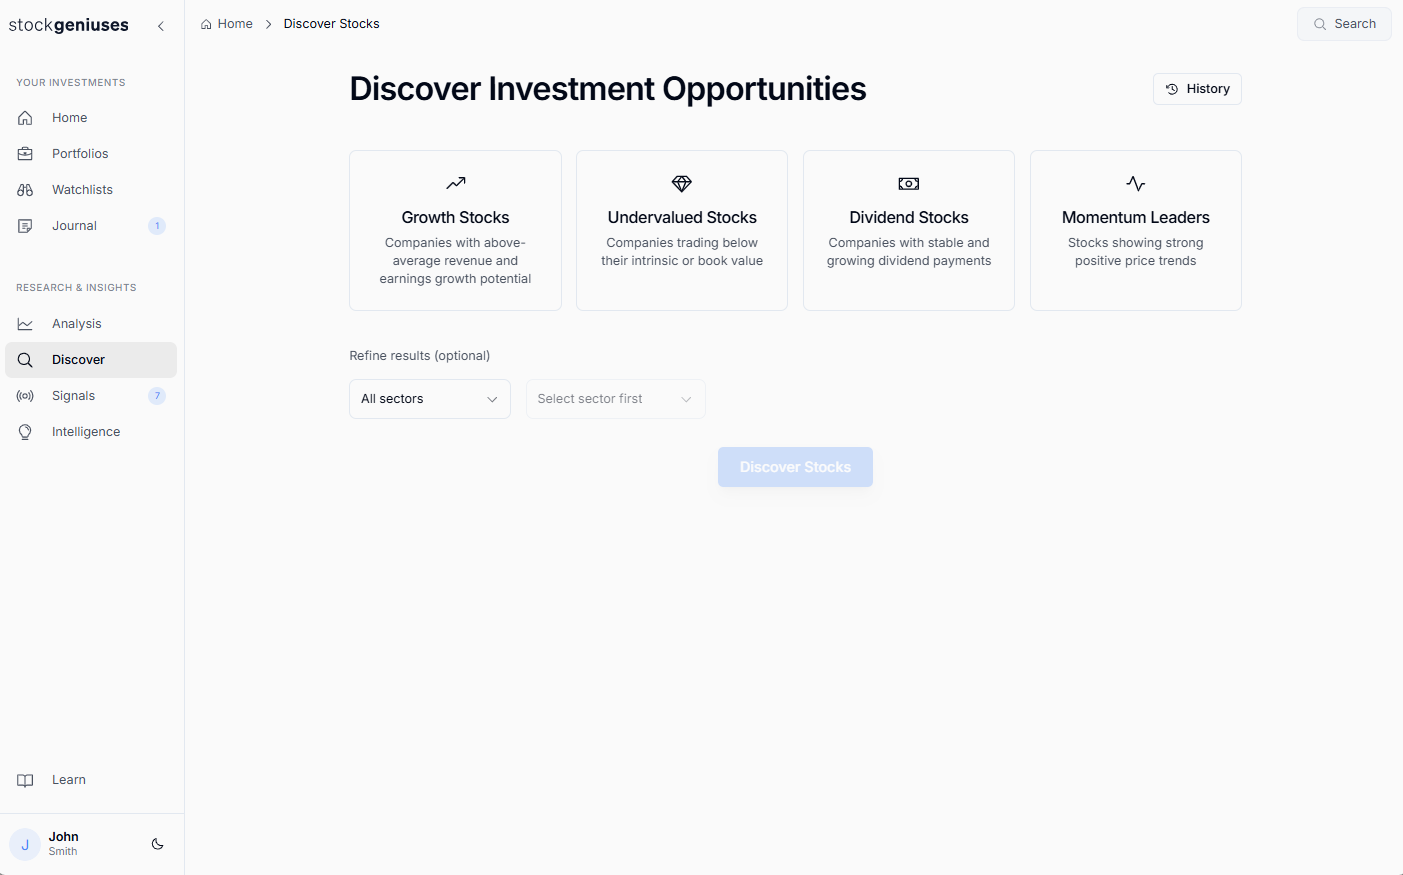
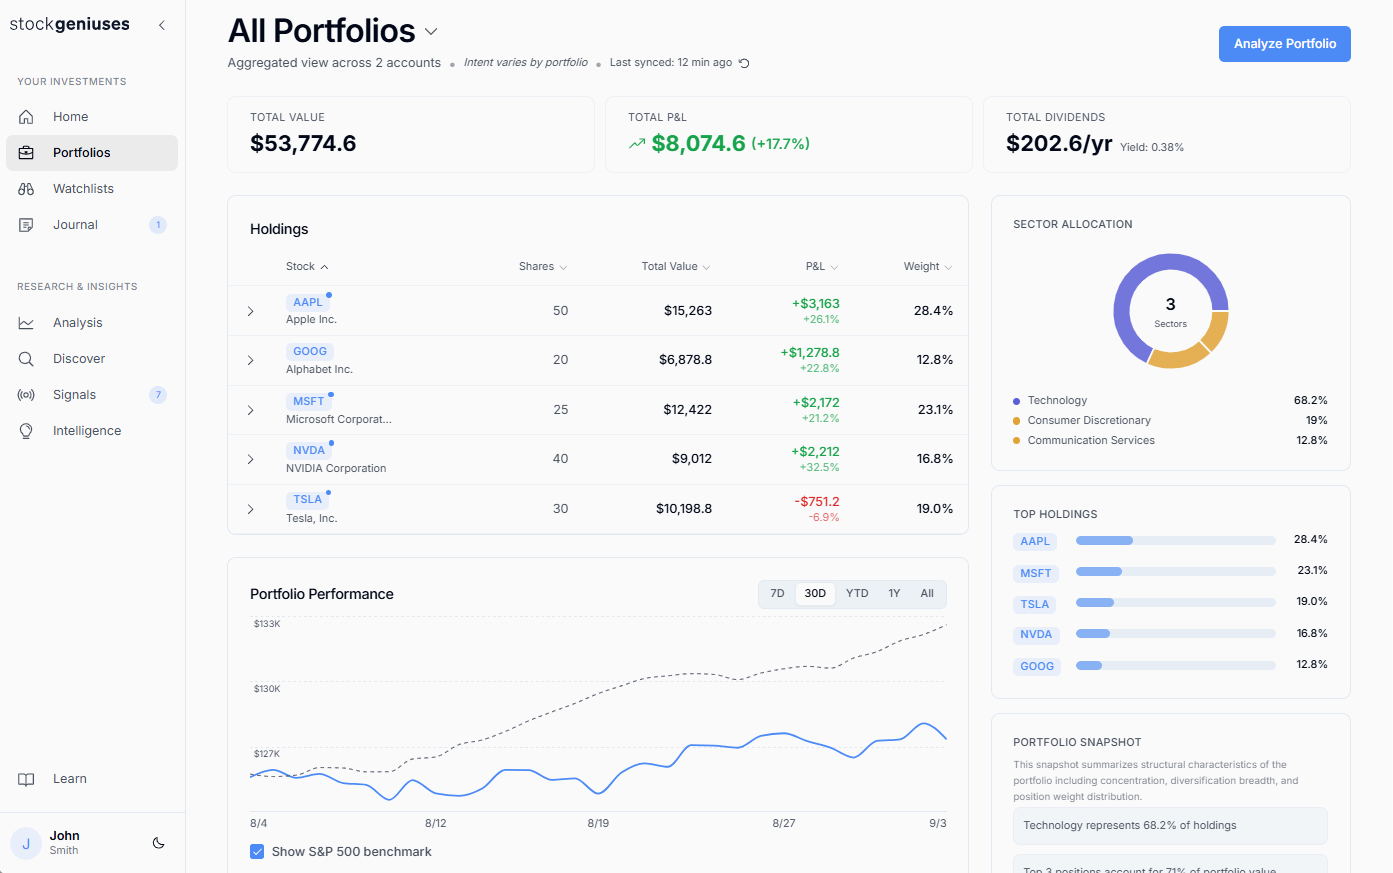
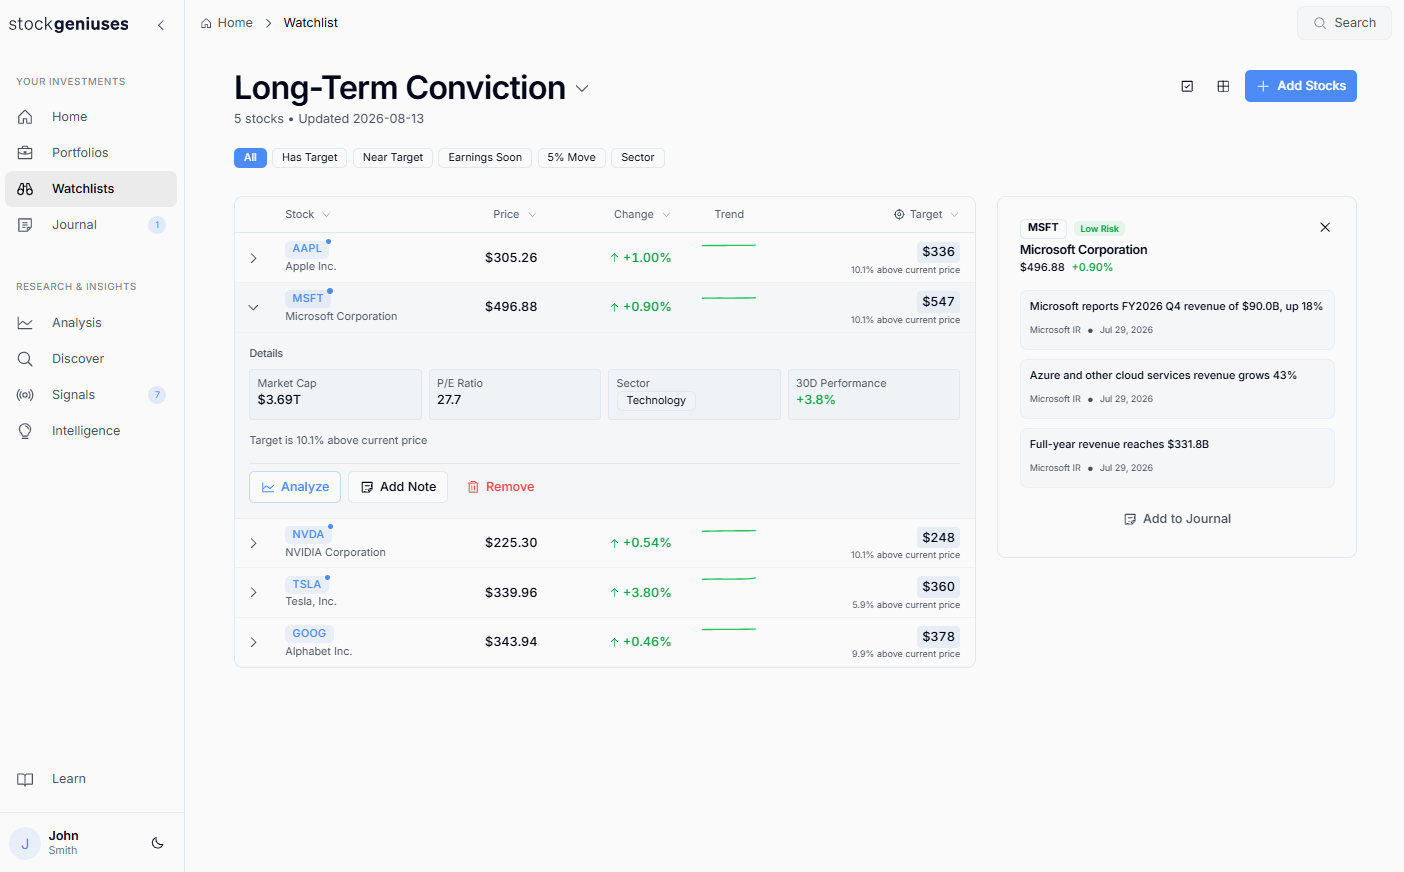
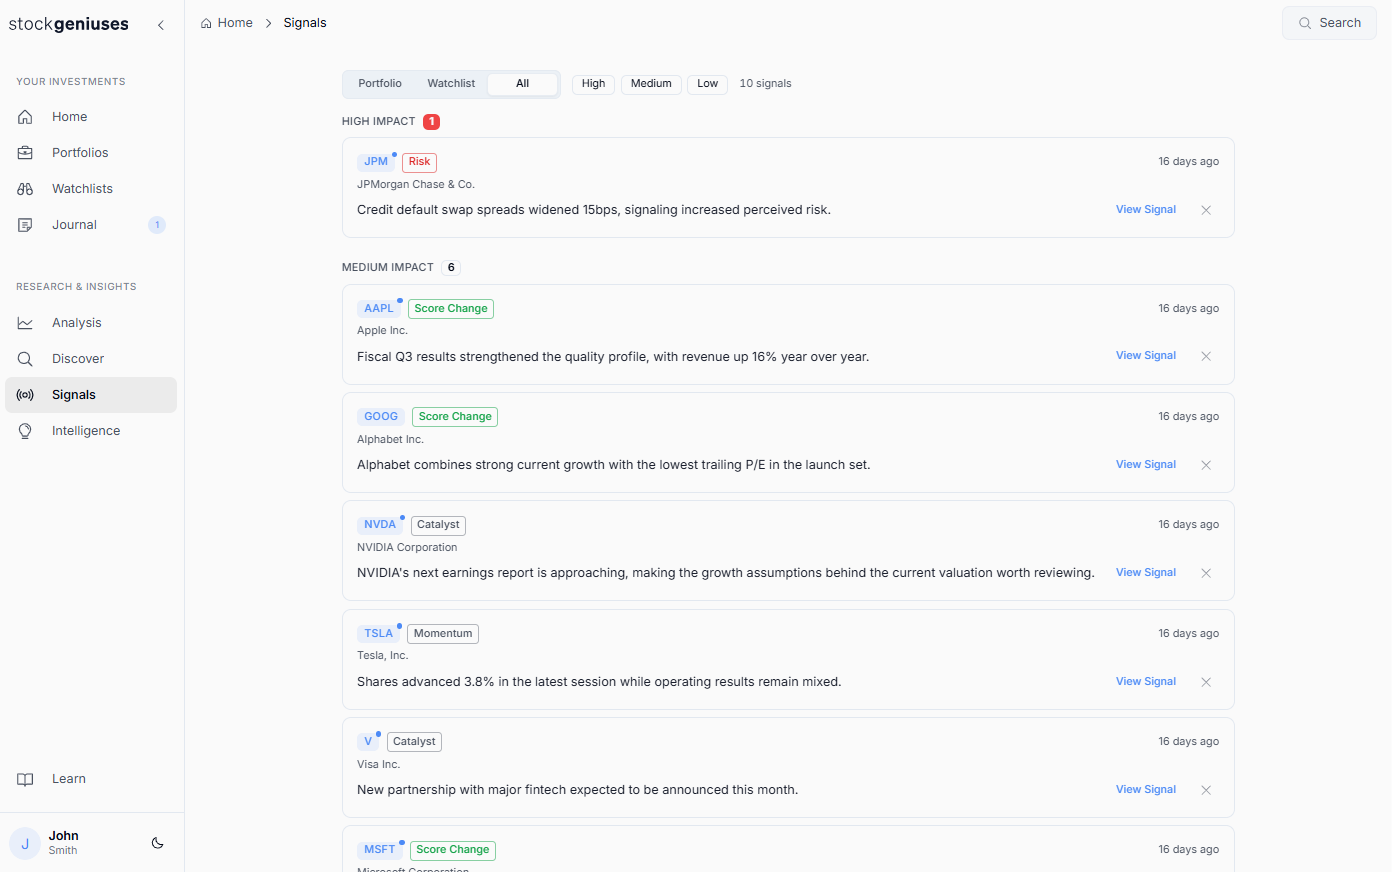
Silent interface demonstration showing a user selecting stocks, choosing investing models, generating an analysis, reviewing model results and plain-English explanations, and carrying the findings into the connected decision workspace. The surrounding page describes the same workflow in text.

Stock research is scattered. So are the decisions that follow.

Screeners, broker dashboards, spreadsheets, news, notes, watchlists, and portfolio views often live in separate places. What gets lost between them is the thread connecting the evidence to the conclusion.

Every stock becomes a workspace.

Open a ticker and see the full record around it: the analysis you ran, the changes you noticed, the thesis you formed, and the conditions that would challenge it. Analysis, watchlists, portfolio exposure, signals, notes, and decision history stay attached to the same stock.

AAPL
Historical market data through 2026-08-13 · Static product previewAnalysis and journal content is illustrative.

Apple Inc.

Technology
Consumer Electronics

$305.26

+3.01 (+1.00%)

Apple designs and sells consumer devices, operating systems, and digital services. Its hardware portfolio includes iPhone, Mac, iPad, wearables, and accessories. Services extend the ecosystem through the App Store, iCloud, payments, media, and subscriptions. The company uses close hardware and software integration to support customer retention across its installed base. Investors typically watch device demand, services growth, margins, capital returns, and the pace of new platform adoption.

Last analyzed: Quality & Value & Risk 2 months ago

Trading Data

Day Range$302.05 - $306.00
52-Week Range$223.78 - $344.57
Volume38.5M
Avg Volume46.8M

Key Metrics

Market Cap$4.46T
P/E Ratio35.0
Forward P/E33.3
EPS$8.72
Revenue$466.82B
Revenue Growth14.2%
Profit Margin27.6%
Dividend Yield0.35%

Earnings Snapshot

Last QuarterBeat (+$0.09)
Beat/Miss Streak4 / 4 quarters
Next EarningsNot announced

Beat / Miss History

Q2'25
Q3'25
Q4'25
Q1'26

EPS: Actual vs Estimate

QuarterActualEst.Q1'26$2.01$1.92Q4'25$2.84$2.65Q3'25$1.85$1.73Q2'25$1.57$1.42
Consistent Beater

Strategic Context

Strategic Theme
Consumer Platforms
Ecosystem Role
Platform Owner and Device Gatekeeper
Structural Drivers
Installed-base monetization
Services mix
On-device AI adoption
Position Strength
Core

Thesis Summary

Apple combines a large installed base, integrated hardware and software, and recurring services economics. The key question is whether durable cash generation can justify the valuation paid for that quality.

Company Details
Management
CEO:Tim Cook
Ownership
Institutional:62.4%
Insider:0.07%
Additional
HQ:Cupertino, California
Founded:1976
Employees:166,000

Recent Headlines

Apple and Major League Baseball announce the August Friday Night Baseball schedule

Apple Newsroom Jul 9

Apple receives a record 89 Emmy Award nominations

Apple Newsroom Jul 8

Apple expands US chip manufacturing commitments with Broadcom

Apple Newsroom Jul 8

Apple Creator Studio adds new intelligence and workflow features

Apple Newsroom Jun 30

Apple announces changes to iOS in Brazil

Apple Newsroom Jun 18

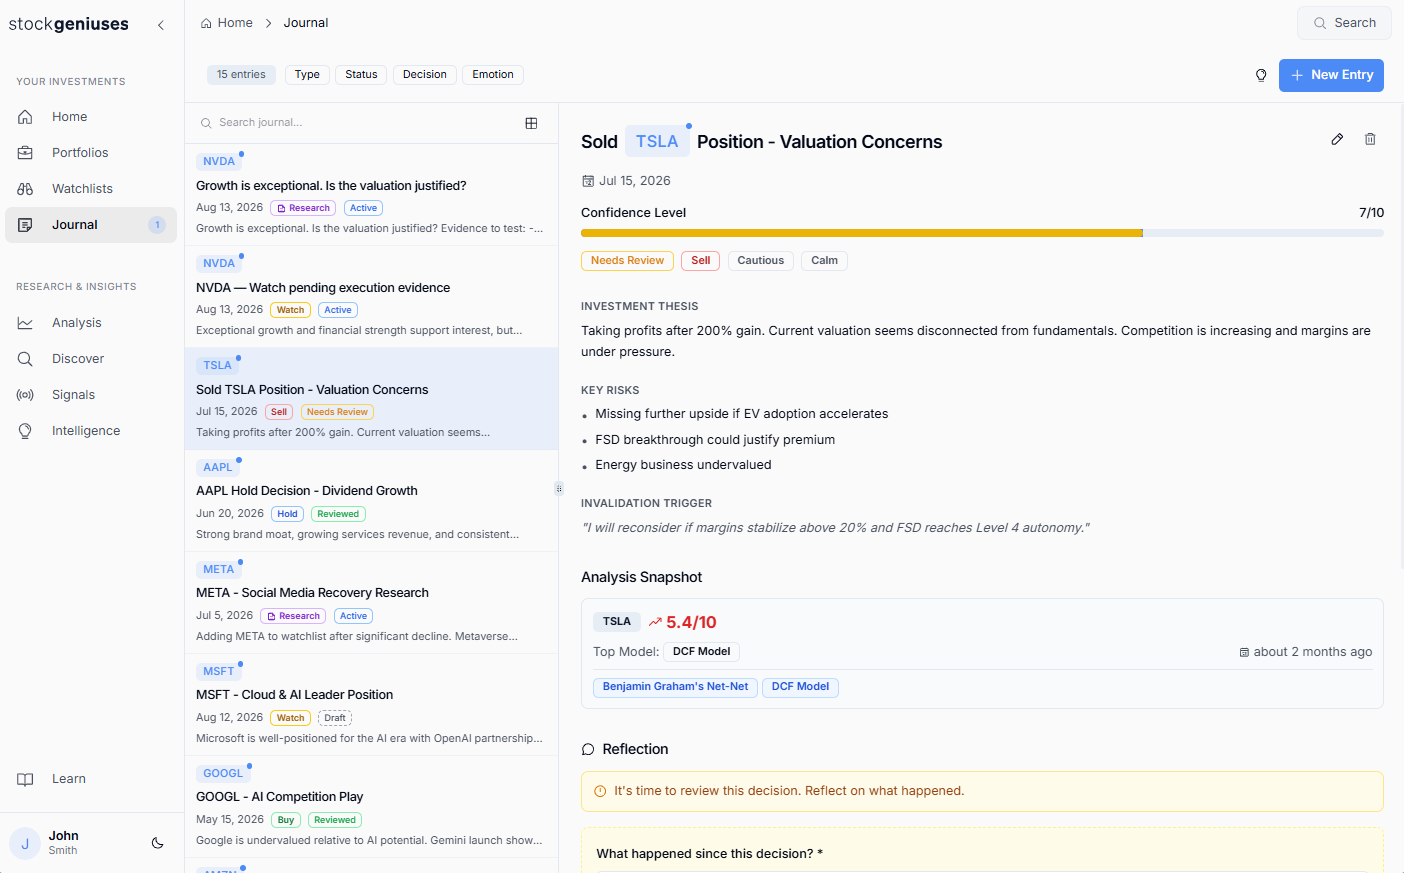
A repeatable loop from idea to review.

Discover a company, analyze it, capture the thesis, follow what changes, and return to the decision with the original assumptions still visible.

01

Discover

Find stocks worth a closer look.

02

Analyze

Test them through structured investing frameworks.

03

Decide

Capture thesis, risks, and invalidation points.

04

Track

Watch what changes after the decision.

05

Reflect

Separate process quality from market outcome.

06

Improve

Recognize patterns and make your next decision more disciplined.

One workflow, one system, from first idea to later review.

Connected investing workflow.

Discovery, analysis, watchlists, portfolios, signals, and journal entries all share the same ticker context, so you can move through the workflow without rebuilding the story each time.

Examine a stock from several investing angles.

Compare how a company looks across value, growth, income, momentum, financial health, sentiment, and business quality.
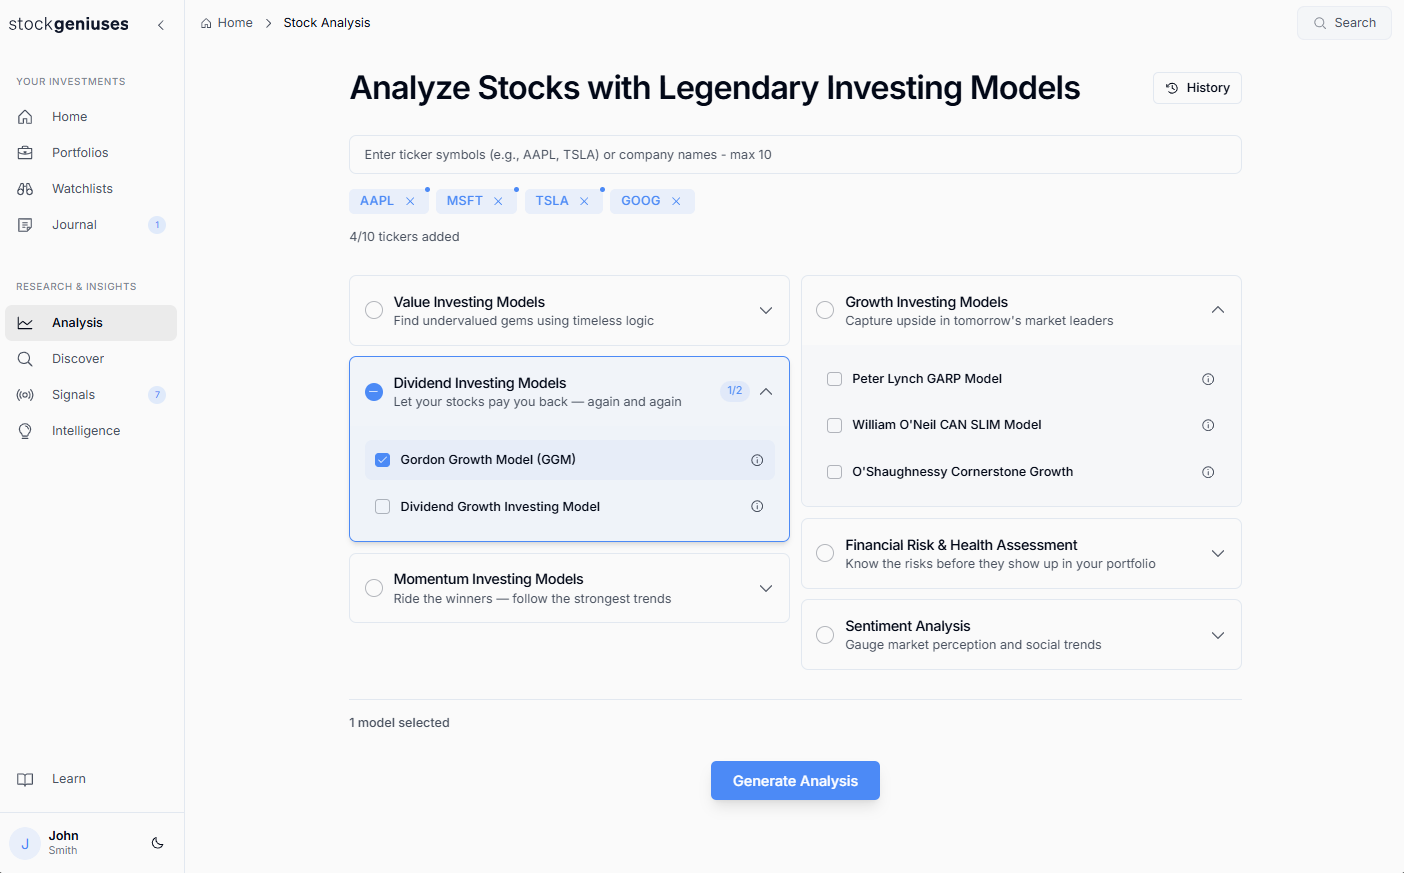
  • 20+ investing models
  • Model-based analysis
  • Plain-English interpretation
StockGeniuses stock analysis screen with investing model selection

Investing frameworks inspired by great investors.

Explore 20+ models shaped by established approaches to value, growth, momentum, income, financial health, sentiment, and business quality.

Warren Buffett

Quality / Intrinsic value

Business quality and long-term value

Benjamin Graham

Deep value

Margin of safety and valuation discipline

Peter Lynch

Growth at a reasonable price

Growth, earnings durability, and business familiarity

William O’Neil

CAN SLIM / Momentum

Growth, market leadership, and price strength

James O’Shaughnessy

Factor-based value

Factor discipline and trending value

Joel Greenblatt

Quality / Value

Business quality paired with valuation

Compare several perspectives before forming a view.

Defined models turn financial data into analysis you can understand.

StockGeniuses prepares the financial and market information each framework requires, applies its defined calculations and rules, and brings the results together in one workspace. AI then helps explain what the analysis shows and where uncertainty remains.

Financial & Market Data

The company and market data each investing framework requires.

  • Company financials
  • Prices and market history
  • Reporting periods
  • Company events

StockGeniuses Engine

Prepare the inputs

  • Align reporting periods
  • Organize required metrics
  • Review data coverage and missing inputs
  • Confirm framework eligibility

Apply defined model logic

  • Run framework-specific calculations
  • Apply assumptions and scoring rules
  • Apply relevant valuation, growth, quality, and risk checks

Decision Workspace

The result stays connected to the stock and the decision around it.

  • Model results and AI explanations
  • Portfolio and watchlist context
  • Signals and company changes
  • Journal and decision history

Built for investors who want a process, not a prediction machine.

For self-directed investors who want a consistent way to research companies, make deliberate decisions, and learn from earlier choices.

Built for

Investors who want structure

Not built for

Users looking for predictions

Self-directed investors
Day traders
Long-term thinkers
Signal chasers
Semi-professional investors
Guaranteed-return seekers
Ambitious beginners who want structure
Users looking for buy/sell calls
Investors who want clarity without hype
Investors chasing hype

One complete research workflow. Two ways to use it.

Start with 14 days of Premium features, with trial analysis limits, no credit card required, and no automatic billing. Continue with Premium for the complete workflow, or choose Pro for higher-volume research.

Premium

Best for most investors

For self-directed investors managing an active stock research process.

$29/month

Or $290 per year when billed annually.

  • 100 stock analyses per month
  • 20 Discover sessions per month
  • Every core StockGeniuses capability
  • Standard support

Pro

For higher-volume research

For active investors researching more companies and working at greater scale.

$59/month

Or $590 per year when billed annually.

  • Everything in Premium
  • 300 stock analyses per month
  • 60 Discover sessions per month
  • Priority support and early feature access

Included in both plans

Premium and Pro include the same complete decision workflow. Pro adds capacity, not a better product.

Structured stock analysis

20+ investing frameworks, Core Metrics, and cross-category Summary.

Plain-English interpretation

Model meaning, drivers, data quality, uncertainty, and tradeoffs.

Stock Discovery

Candidate screening, ranking, rationale, and batch research actions.

Connected ticker context

Company overview, timeline, earnings context, signals, and history.

Portfolios and monitoring

Unlimited watchlists and manual portfolios with connected stock context.

Decision memory

Unlimited research notes, thesis, risks, invalidation, decisions, and reviews.

Questions before you get started

A few practical answers about the product and its scope.

No. StockGeniuses supports research and decision-making by bringing analysis, AI explanations, and your own notes into one workspace. It does not provide personalized financial advice, buy/sell recommendations, or guaranteed outcomes.

StockGeniuses is currently focused on publicly traded equities. Crypto, commodities, bonds, forex, options, and other security classes are not supported at launch.

AI explains model outputs, summarizes relevant information, highlights tradeoffs, and helps you review earlier decisions. It does not tell you what to buy or replace your judgment.

It is designed for self-directed investors—from ambitious beginners to experienced retail investors—who want a consistent way to research companies and revisit their decisions over time.

No. The product is designed for company research, portfolio awareness, and decision review rather than rapid-fire trading or short-term signals.

The platform includes 20+ models spanning value, growth, dividend income, momentum, financial health and risk, sentiment, and core company metrics.

Yes. Analysis, watchlists, portfolios, signals, and journal entries share ticker-level context, so the research record stays together as it develops.

It means every ticker can hold its own analysis, company overview, timeline, signals, journal entries, and decision history—giving you one record to return to as the story changes.

You will join the StockGeniuses early-access list. We will use your email to send launch updates, access details, and availability information as the platform approaches public release.

Bring your stock research into one connected workflow.

Keep analysis, AI explanations, watchlists, portfolios, signals, and journal entries connected from the first idea to the later review.

No buy/sell signals. No hype. Just a calmer workspace for better stock decisions.